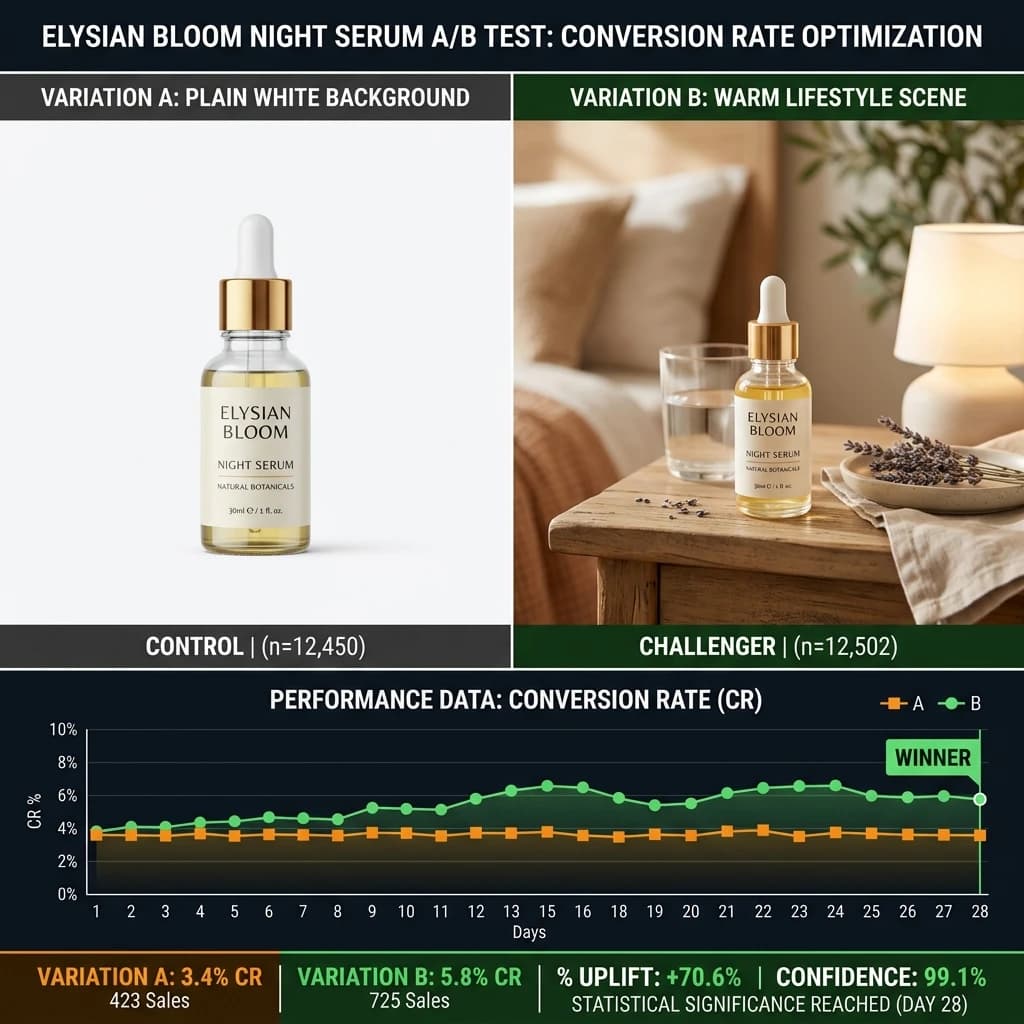
On most e-commerce platforms, the product image is the first decision point — it determines whether a shopper clicks your listing or the next one. Yet most sellers swap images based on intuition rather than data, miss the one variable that drove the result, or declare a winner from a sample size too small to mean anything. This guide covers how to run image A/B tests that actually tell you something: what to test, which platform tools to use, what counts as a valid result, and what the broader industry data suggests about which image types tend to win — and in which categories.
Why Product Images Are the Highest-Leverage Conversion Variable
Copy, price, and reviews all matter, but images operate at the moment of first impression — before a shopper has read a single word of your listing. On Amazon, the main image is what drives click-through from search results. On Etsy, the thumbnail determines whether your product appears at all in a browsing shopper's visual sweep. Research across e-commerce platforms consistently shows that main image swaps produce larger conversion lifts than copy rewrites or price adjustments at equivalent effort. A 0.5% improvement in conversion rate on a high-volume listing can represent meaningful revenue over a quarter — and a single winning image can run without further cost for months or years.
The reason images outperform copy as a test variable is cognitive: visual processing is faster and more decisive than reading. A shopper decides whether a product looks right in milliseconds. Copy modifies that decision; images create it.
What to Test: The High-Value Variables
Main Image Background: White vs. Lifestyle
White background main images are required by Amazon for main image compliance and are common on most major platforms. Lifestyle images — showing the product in use, in a context — are allowed as alternate images on Amazon but permitted as main images on Etsy, Shopify, and many others. Testing which performs better as a thumbnail is category-dependent:
- Hard goods, electronics, tools: White background typically wins on click-through. Shoppers searching for a specific product want to see the product clearly, without environmental distraction.
- Apparel, home decor, gifts: Lifestyle imagery frequently outperforms white background on platforms where it's allowed as the main image. Context helps buyers visualise the product in their own lives.
- Beauty and cosmetics: Results are split — hero product shots on white often win for established brands; aspirational lifestyle imagery wins more often for new or mid-market brands entering the category.
Camera Angle: Front vs. Three-Quarter View
A straight-on front view communicates product dimensions clearly. A three-quarter angle adds depth and shows more of the product's form at once. For most three-dimensional products — bags, footwear, packaging — the three-quarter view tends to outperform frontal shots in click-through tests. For flat products like apparel laid flat or posters, a direct overhead angle usually performs better. Test your specific product category rather than assuming.
Hero Product Alone vs. In Use
Testing a clean product image against an in-use shot reveals how much context your category needs. A drill shown in use next to a workbench communicates scale and application. A candle photographed burning in a styled interior communicates mood. Test these against clean product shots and measure both click-through rate (CTR) from search and add-to-cart rate. The two metrics sometimes point in different directions: a lifestyle image may drive more clicks but a clearer product shot may convert better once clicked through.
With vs. Without a Human Model
Industry A/B test data consistently shows that adding a human element — a hand, a face, a model wearing the product — increases engagement in apparel, jewellery, and beauty categories. Human presence signals scale, demonstrates wearability, and triggers social processing. However, model images require significantly higher production investment. The test question is whether the conversion lift justifies that cost. Our e-commerce photo editing service can produce consistent, retouched model images at volume, which makes the production side of this test more accessible.
Platform A/B Testing Tools
Amazon: Manage Your Experiments
Amazon's Manage Your Experiments (MYE) tool is available to brand-registered sellers through Seller Central. It allows you to run controlled split tests on main images, secondary images, titles, and A+ content — with Amazon randomly assigning shoppers to variant A or B and tracking the results against conversion rate, clicks, and sales.
To set up an image test in MYE:
- Navigate to Seller Central → Brands → Manage Your Experiments
- Select the ASIN you want to test and choose "Create a new experiment"
- Upload your variant image and set the experiment duration (Amazon recommends a minimum of 4 weeks)
- Minimum traffic requirement: Amazon will flag if a listing has insufficient traffic to generate a statistically valid result. Low-traffic listings should be excluded from testing until organic traffic builds.
MYE provides a built-in statistical confidence indicator and will flag when a winner has been identified at 95% confidence — the standard threshold for a valid result. Do not end experiments early based on early trends; early leaders frequently lose significance as sample size grows.
Etsy: Built-In Listing A/B Tool
Etsy's A/B testing feature (available to qualifying sellers through the Etsy Seller Dashboard) allows split testing of listing images, thumbnails, and titles. Etsy automatically rotates between variants and tracks click-through rate and conversion rate at the listing level. The interface is simpler than Amazon's MYE but operates on the same principle: equal random exposure to each variant, tracked against conversion outcomes. Because Etsy's organic discovery relies heavily on visual search, thumbnail performance is particularly high-leverage on this platform.
Other Platforms: Manual Split Testing
For platforms without native A/B tools — Shopify stores, WooCommerce, independent sites — you have two main options:
- Traffic segmentation by date: Run variant A for two weeks, then swap to variant B for two weeks, keeping all other variables constant. Compare conversion rate across periods. The limitation is that seasonal variation, ad spend changes, or algorithm shifts can contaminate results — so this method is less reliable than a true simultaneous split.
- Third-party tools: Google Optimize alternatives (VWO, Convert, AB Tasty) allow true simultaneous A/B split testing on product pages and can be integrated with Shopify and WooCommerce. These require more setup but produce cleaner data, especially for higher-traffic stores.
Statistical Significance: Why Sample Size Matters
The most common mistake in image A/B testing is ending a test too early. If you look at results after 50 visitors and variant B is ahead, that lead is almost certainly noise. Statistical significance requires enough data to rule out chance variation as the explanation for the difference you're seeing.
The standard threshold is 95% confidence, meaning there is only a 5% probability that the observed difference occurred by chance. To reach that threshold, you typically need:
- A minimum of 100 conversions per variant (not per test) — so 200 total conversions before drawing conclusions
- At least two weeks of data to account for day-of-week and time-of-day variation in buyer behaviour
- A pre-defined primary metric (CTR or conversion rate — not both; choose one before the test starts)
Use a free significance calculator (AB Testguide, Evan Miller's calculator) to check whether your observed lift is statistically significant before declaring a winner. Amazon's MYE does this automatically; on other platforms you'll need to calculate it manually.
What Data to Collect
Different metrics tell you different things about image performance:
- Click-through rate (CTR) from search: Measures the thumbnail's power to attract clicks. High CTR but low conversion rate means the main image is attracting clicks that the listing content then fails to convert — the image may be misleading or the product page is weak.
- Conversion rate (add to cart / purchase): Measures how effectively the image and listing together turn visitors into buyers. This is the end-metric that matters for revenue.
- Return rate: A metric often overlooked in image testing. If an image drives conversions but the product looks different in person from how it looked in the photo, return rates will rise. Test images should reflect the product accurately — not just attract clicks. Accurate colour is a particular lever here; see our guide to colour correction and return reduction for more detail.
Common Test Results from Industry Data
While every product category behaves differently, some patterns appear consistently across large-scale e-commerce image tests:
- Lifestyle main image vs. white background (apparel): Lifestyle imagery wins on Etsy and Shopify by 10–30% in CTR tests, consistently. On Amazon (where lifestyle is not permitted as main image), this test is irrelevant for compliance reasons, but lifestyle images in secondary slots improve overall conversion rate.
- Human presence effect: Adding a hand or model to a product image increases CTR by 5–20% in jewellery, apparel, and beauty categories across multiple published platform studies. The effect is smaller or absent in tool, electronics, and commodity categories.
- Background complexity: Clean, uncluttered backgrounds — whether white or a single solid colour — consistently outperform busy lifestyle backgrounds in main image positions. The product should be the visual subject; competing elements reduce clarity and hurt CTR.
- Multiple angles vs. single view: Listings with 5+ images consistently outperform listings with 1–2 images in conversion rate, even when the main image is identical. The number of secondary images is itself a conversion factor — buyers want to see the product from multiple angles before committing.
Common Mistakes in Image A/B Testing
- Testing too many variables at once: Changing background, angle, and model presence in the same test means you cannot know which variable drove the result. Test one thing at a time.
- Ending tests too early: A variant that leads after 3 days may be behind after 3 weeks. Run tests for at least the minimum recommended duration before touching the results.
- Ignoring return rate: A conversion lift built on misleading imagery will reverse over time through returns and negative reviews. Always track return rate as a secondary metric in image tests.
- Testing on low-traffic ASINs: A listing receiving 10 sessions per day will take months to generate a statistically valid result. Prioritise image testing on your highest-traffic, highest-revenue listings first.
- Not documenting the test: Record every test — variant images, dates, sample sizes, primary metric, result. This institutional knowledge prevents re-running tests you've already answered and builds a decision library over time.
When to Outsource Image Production for Testing
Running image A/B tests requires a supply of variant images. If you're testing white background vs. lifestyle, with model vs. without model, front angle vs. three-quarter — you need multiple professional-quality variants of each product. Producing these in-house requires photography equipment, studio time, and retouching. For most e-commerce brands, the cost and time of in-house production is the bottleneck that prevents testing from happening at all.
Outsourcing image variants to a retouching studio removes that bottleneck. For products you already have on white background, lifestyle composites, angle variations, and model retouching can be produced from existing shots — giving you testable variants without a full re-shoot. Our e-commerce photo editing service handles variant production at scale, with consistent retouching quality across all variants so that image quality is not itself a confounding variable in your tests. Submit 5 images for a free trial batch to see what's achievable with your existing product images.